
Contracts
Control contracts
Monitor profitability, SLA, complaints, renewals, and risk per client.
ContractsTendersRenewals
INVO gives owners, board members, and executive teams one system to understand what is happening across contracts, facilities, kitchens, production, logistics, purchasing, SLA, and margin - without waiting for manual reports or disconnected Excel files. See which contracts are profitable, where costs are leaking, which facilities create operational risk, and how today's execution impacts tomorrow's P&L.
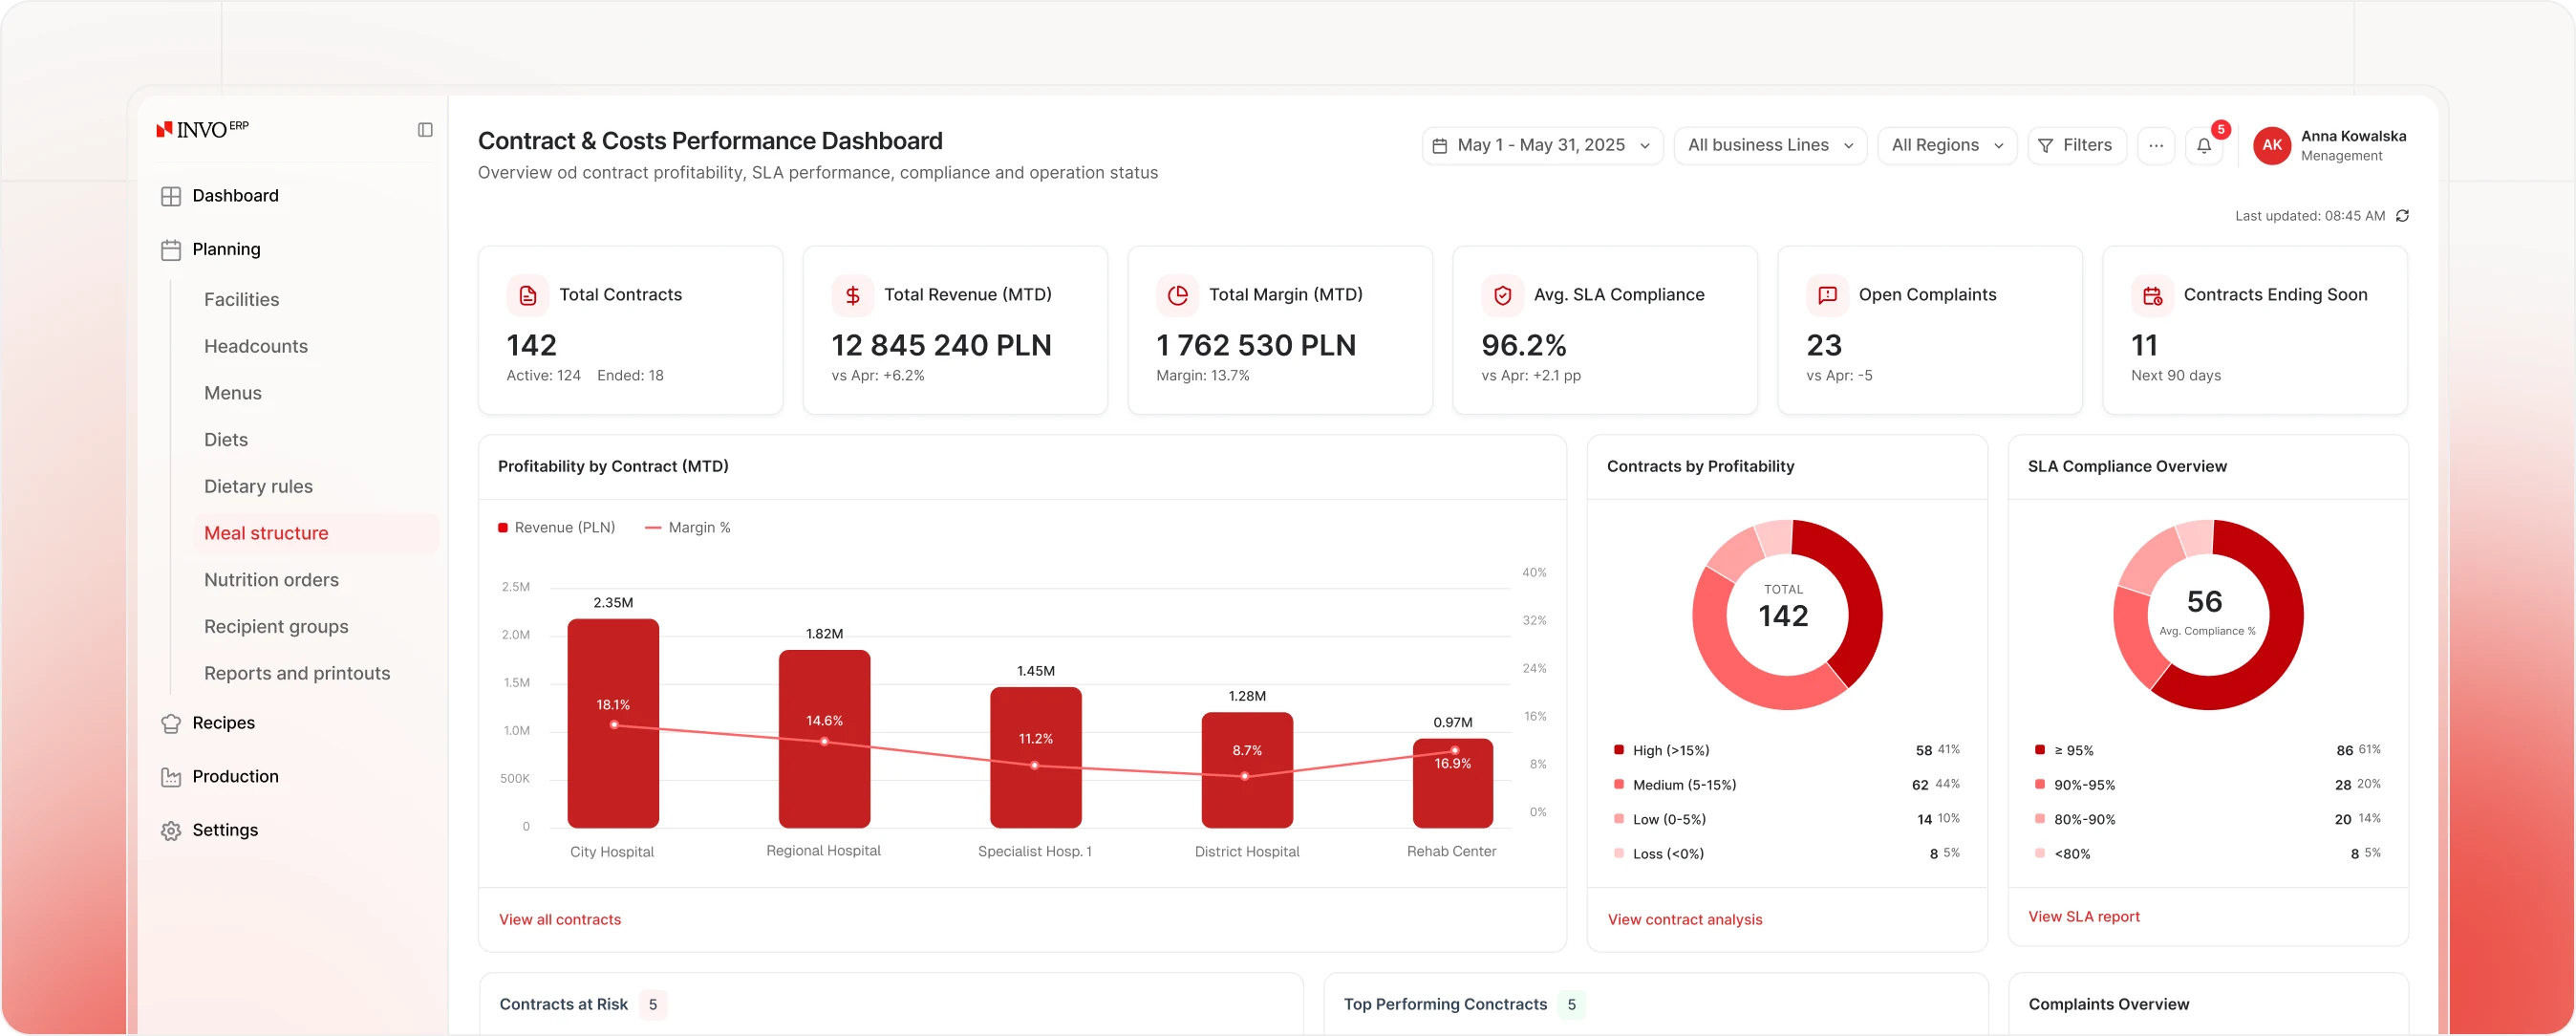
Executive visibility
INVO turns daily operations into board-level indicators. Every order, correction, production run, delivery, complaint, ingredient purchase, and report feeds one management layer.
Contract margin
18.4%
Food cost variance
−3.2%
SLA compliance
98.6%
Operational risk
7
The executive problem
In large foodservice operations, the board sees revenue and monthly financial reports - but not the operational causes behind margin loss. Orders run in multiple channels, production is planned manually, and purchasing is disconnected from real demand. The result: management reacts after the margin is already lost.
Revenue is visible, but real margin per contract, facility, diet, meal, or location is hard to calculate.
Missing meal counts, late corrections, production delays, purchasing shortages, and delivery issues are spread across teams.
Data is manually consolidated after the fact, instead of being available in real time.
Different teams work on different versions of orders, costs, menus, deliveries, and complaints.
The executive solution
Contracts
Monitor profitability, SLA, complaints, renewals, and risk per client.
Operations
Track production, logistics, purchasing, and meal counts in real time.
Costs
Connect recipes, ingredients, purchasing, labor, and waste to real food cost.
Scale
Manage many kitchens, facilities, contracts, and business lines from one platform.
Command center
The Executive Command Center gives board members a real-time view of business health across contracts, kitchens, facilities, production, logistics, purchasing, complaints, and reporting.
One real-time layer showing margin, risk, service quality, and execution across every contract and facility.
Active contracts
142
Avg contract margin
18.4%
Open risks
7
SLA compliance
98.6%
Group overview
Contract profitability
INVO connects contract assumptions with real execution data. Management can compare planned margin against actual operational performance: meal volumes, food costs, production variances, complaints, SLA, and logistics cost - before the P&L is closed.
Multi-site control
For companies operating many facilities and kitchens, INVO gives management a consistent way to compare performance across the entire organization - which kitchens run efficiently, which facilities generate the most corrections or complaints, and where standardization is needed.
Headquarters
Kitchens
Facilities
Service quality
INVO gives management a live view of service quality across facilities. Complaints, response times, delivery quality, order completeness, and SLA breaches are tracked against contract terms - so executives can identify clients at risk and intervene early.
SLA compliance
+0.4pp98.6%
Open complaints
12
−5Avg response time
2.4h
−0.6hCost control
INVO lets executive teams understand how daily operations impact cost and margin. Recipes, ingredients, purchasing, production plans, waste, and meal volumes are connected into one cost layer - showing where food cost rises, where purchasing creates savings, and where variances generate unnecessary cost.
Recipes
Recipe cost, ingredient prices, diet and meal-level costing.
Production
Plan execution, rework, waste, delays, and bottlenecks.
Purchasing
Supplier prices, purchase coverage, shortages, and savings.
Cost
Real food cost consolidated from every operational input.
Margin
Live contract margin updated as operations execute.
Business impact
5-15%
reduction in labor-related operational effort
3-10%
reduction in food cost leakage
30-70%
fewer operational errors from manual coordination
2-8%
purchasing savings potential
50-80%
shorter reporting time
+2-6 pp
contract margin improvement potential
Actual impact depends on operational scale, implementation scope, and baseline maturity.
Implementation model
Set up roles, contracts, facilities, workflows, cut-offs, dashboards, and reporting logic.
Add integrations, custom processes, business rules, and management dashboards.
Roll out across new kitchens, facilities, regions, contracts, and business lines.